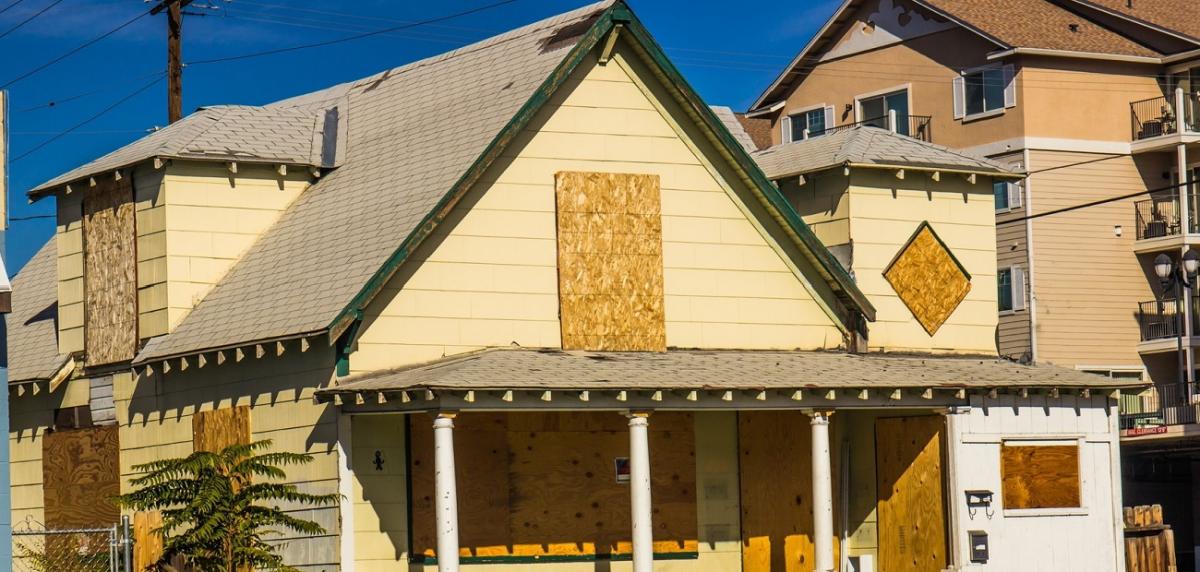
A total of 143,105 properties nationwide received a foreclosure filing—default notice, scheduled auction, or bank repossession—in the third quarter of this year, the lowest level since the second quarter of 2005, ATTOM Data Solutions reports in its latest Foreclosure Market Report. U.S. foreclosure activity is now 49% below the prerecession average of 278,912 between the first quarter of 2006 and the third quarter of 2007, ATTOM Data reports.
“Foreclosure activity continues to decline across the country, which is a good sign that the housing market and the broader economy remain strong—and that the lending excesses that helped bring down the economy during the Great Recession remain a memory,” says Todd Teta, chief product officer at ATTOM Data Solutions. “This is not to say that everything in the latest foreclosure picture is rosy. Some states have seen their foreclosure rates increase this year, which could cause some concern.”
Foreclosures are up in 30% of the local markets tracked by ATTOM Data. Fourteen states countered the national trend and posted year-over-year increases in foreclosure starts in the third quarter. Some of those states include:
- Montana (up 33%)
- Georgia (up 32%)
- Washington (up 16%)
- Louisiana (up 15%)
- Michigan (up 12%)
On a metro level, markets with at least 1 million people that posted the largest year-over-year increases in foreclosures last quarter were:
- Atlanta (up 37%)
- Columbus, Ohio (up 27%)
- San Antonio (up 24%)
- Portland, Ore. (up 22%)
- Tucson, Ariz. (up 21%)
Properties that were foreclosed on during the third quarter saw a long, drawn-out process. The average time to foreclose rose from an average of 713 days a year ago to 841 days last quarter. The states that had the longest average foreclosure timelines were:
- Indiana (1,633 days)
- Hawaii (1,626 days)
- Nevada (1,511 days)
- New Jersey (1,173 days)
- Georgia (1,170 days)
On the other hand, the states with the shortest average foreclosure timelines were:
- Virginia (201 days)
- Montana (217 days)
- Mississippi (229 days)
- Alaska (258 days)
- Oregon (283 days
Source: magazine.realtor ~ Image: magazine.realtor
