Skip to content

Lazar Real Estate Services

Turlock Homes & Beyond | BRE# 01112786 | Century21 Select Group

  • About
    • Client Testimonials
    • Contact
  • Search
    • Featured Properties
    • Turlock Homes for Sale
    • Residential for Sale
    • Solds
      • Pending Sale
    • Lots and Land for Sale
  • Resources
    • Turlock Resources
    • Merced Resources
    • Modesto Resources
  • Residential Services
    • John & Nellie Lazar Sell Homes
    • Let’s Find Your Dream Home
    • Get New Listing & Price Change Alerts
  • Commercial & Land
    • Commercial for Sale
  • Home By Design
  • Blog
  • Home
  • Blog
  • Pools May Add a Splash to Home Value

Pools May Add a Splash to Home Value

Posted on August 23, 2019 By admin No Comments on Pools May Add a Splash to Home Value
Blog

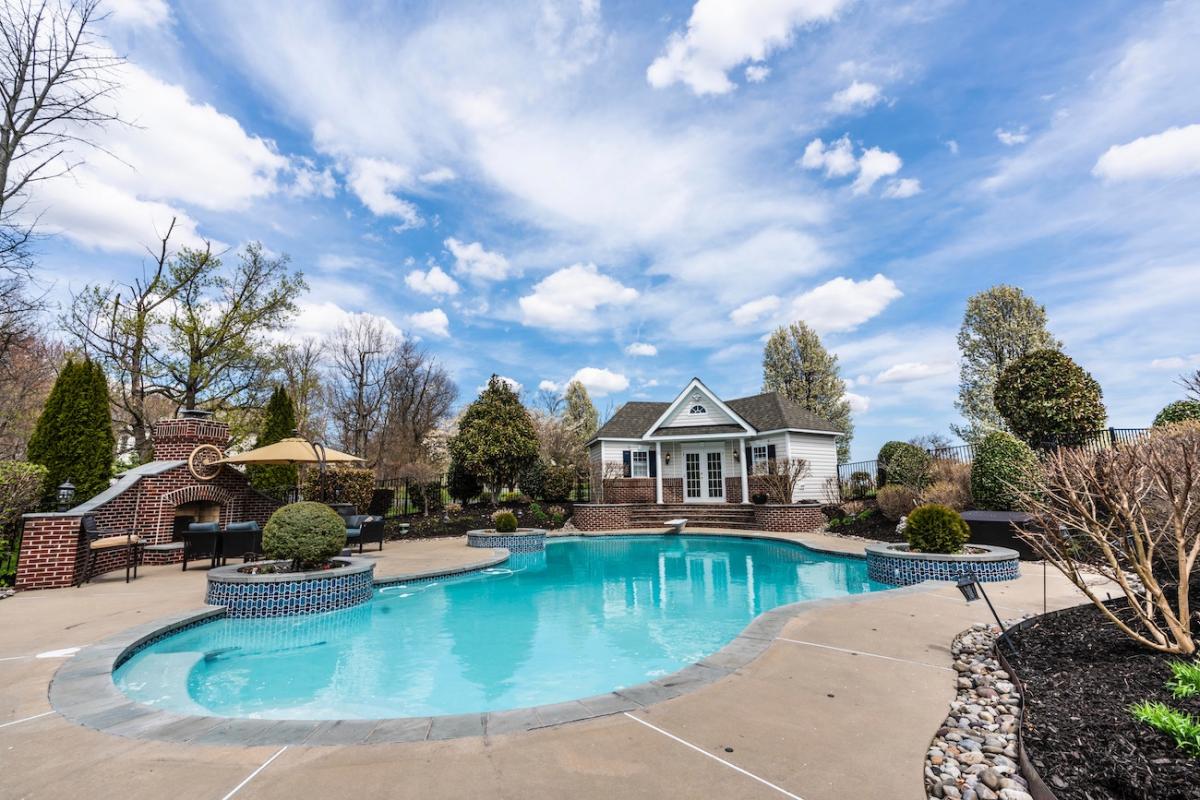
Swimming pools can help to significantly boost a home price. A new study from LendingTree shows that homes with pools are valued 54% higher than those without one.

The median home with a pool is valued at $469,187, while the median home without a pool is valued at $305,152, according to the study. The highest premium for a swimming pool was found in Memphis, with a value of 157% higher than homes without one.

Pools are still a relatively rare amenity in markets across the country. Only about 10% of homes in the U.S. have a swimming pool among the 50 largest cities studied.

Warmer climates tend to have the most. For example, in Phoenix, 33% of homes have a swimming pool compared to just 1% in Portland, Ore. Six of the top 10 cities for swimming pools are in the West.

Cities ranked by share of homes with swimming pools
Based on total value Based on price per square foot Median size (sq. ft.) Median value Price per sq. ft. Median size (sq. ft.) Median value Price per sq. ft.
Phoenix 32.7% 58.5% 15.6% 2,258 $355,000 $157 1,647 $224,000 $136
Miami 30.6% 62.8% 7.1% 2,316 $459,000 $198 1,524 $282,000 $185
Tampa, Fla. 27.7% 64.4% 14.1% 2,018 $296,000 $147 1,400 $180,000 $129
Orlando, Fla. 25.9% 49.0% 6.8% 2,245 $307,000 $137 1,609 $206,000 $128
Las Vegas 23.8% 48.1% 5.7% 2,368 $357,000 $151 1,690 $241,000 $143
Los Angeles 19.0% 32.4% -8.7% 2,206 $814,000 $369 1,522 $615,000 $404
Riverside, Calif. 18.3% 38.5% 1.8% 2,166 $450,000 $208 1,592 $325,000 $204
San Diego 17.0% 25.7% -10.6% 2,334 $729,000 $312 1,660 $580,000 $349
Sacramento, Calif. 14.0% 29.8% -5.2% 2,173 $488,000 $225 1,587 $376,000 $237
Dallas 13.8% 89.6% 16.9% 2,840 $381,000 $134 1,751 $201,000 $115
San Jose, Calif. 12.6% 45.0% 5.9% 2,250 $1,628,000 $724 1,644 $1,123,000 $683
Jacksonville, Fla. 12.3% 74.6% 24.4% 2,249 $302,000 $134 1,603 $173,000 $108
Houston 9.1% 82.8% 14.1% 2,986 $340,000 $114 1,864 $186,000 $100
San Francisco 9.0% 32.0% -11.7% 2,364 $1,197,000 $506 1,581 $907,000 $574
Buffalo, N.Y. 8.3% 56.8% 13.7% 1,998 $229,000 $115 1,448 $146,000 $101
Austin, Texas 7.7% 83.6% 12.3% 2,957 $516,000 $175 1,808 $281,000 $155
San Antonio 7.2% 88.0% 15.2% 2,674 $346,000 $129 1,638 $184,000 $112
Memphis, Tenn. 7.1% 156.6% 37.4% 2,909 $290,000 $100 1,558 $113,000 $73
Oklahoma City 6.9% 82.2% 15.2% 2,412 $246,000 $102 1,524 $135,000 $89
Indianapolis 6.9% 24.8% 1.4% 2,012 $161,000 $80 1,635 $129,000 $79
Virginia Beach, Va. 6.6% 80.2% 16.6% 2,591 $400,000 $154 1,676 $222,000 $132
Providence, R.I. 5.9% -0.9% -11.1% 1,632 $286,500 $176 1,463 $289,000 $198
Hartford, Conn. 5.8% 17.0% -2.6% 1,891 $282,000 $149 1,574 $241,000 $153
New Orleans 5.4% 70.8% 13.3% 2,826 $362,000 $128 1,875 $212,000 $113
Washington, D.C. 5.4% 16.1% -8.4% 2,492 $563,000 $226 1,966 $485,000 $247
Baltimore 5.3% 59.9% 4.2% 2,245 $462,000 $206 1,464 $289,000 $197
Atlanta 4.8% 47.9% 12.8% 2,499 $287,000 $115 1,905 $194,000 $102
Cincinnati 4.7% 40.0% 6.3% 2,088 $231,000 $111 1,586 $165,000 $104
Boston 4.6% 5.7% -9.4% 2,048 $486,000 $237 1,757 $460,000 $262
New York 4.5% 15.6% -10.5% 2,170 $490,000 $226 1,681 $424,000 $252
Charlotte, N.C. 4.5% 68.4% 12.7% 2,570 $320,000 $125 1,720 $190,000 $110
Nashville, Tenn 4.0% 82.2% 6.6% 2,894 $419,000 $145 1,693 $230,000 $136
Richmond, Va. 3.9% 20.9% -7.8% 2,209 $266,000 $120 1,684 $220,000 $131
Birmingham, Ala. 3.9% 75.9% 18.7% 2,230 $241,000 $108 1,505 $137,000 $91
Philadelphia 3.7% 75.6% 16.9% 2,583 $425,000 $165 1,720 $242,000 $141
St. Louis 3.5% 121.1% 20.8% 2,526 $356,000 $141 1,380 $161,000 $117
Cleveland 3.5% 50.7% 11.4% 2,059 $211,000 $103 1,522 $140,000 $92
Detroit 3.3% 111.5% 38.7% 2,022 $294,000 $145 1,326 $139,000 $105
Columbus, Ohio 3.0% 53.3% 10.6% 2,162 $282,000 $130 1,560 $184,000 $118
Chicago 2.4% -20.0% -37.0% 1,916 $188,000 $98 1,510 $235,000 $156
Raleigh, N.C. 2.3% 65.9% 9.1% 2,835 $385,000 $136 1,864 $232,000 $124
Salt Lake City 1.8% 53.4% -4.8% 2,138 $491,000 $230 1,326 $320,000 $ 241
Minneapolis 1.8% 42.6% -0.2% 1,938 $388,000 $200 1,356 $272,000 $201
Milwaukee 1.8% 61.1% 7.8% 2,068 $282,000 $136 1,383 $175,000 $127
Denver 1.7% -0.5% -0.5% 1,682 $411,000 $244 1,682 $413,000 $246
Pittsburgh 1.6% 15.0% 3.3% 1,613 $169,000 $105 1,449 $147,000 $101
Seattle 1.3% 58.3% 16.4% 2,230 $744,000 $334 1,640 $470,000 $287
Kansas City, Mo. 1.2% 103.5% 16.2% 2,492 $346,000 $139 1,423 $170,000 $119
Portland, Ore. 1.0% 49.1% 10.9% 2,151 $574,000 $267 1,600 $385,000 $241
Metropolitan area % of properties with pools Pool premium Homes with swimming pools Homes without swimming pools
Source: realtor.com ~ Chart: LendingTree.com ~ Image: realtor.com

Post navigation

❮ Previous Post: What Families With Young Kids Need in Their Next Home
Next Post: What Can I Do To Sell My Home Fast? ❯

Leave a Reply Cancel reply

Your email address will not be published. Required fields are marked *

Categories

Copyright © 2023 Lazar Real Estate Services.

Theme: Oceanly by ScriptsTown

Cleantalk Pixel